

NBC News on a Chicago Violent Crime Wave:
NBC News on a Chicago Violent Crime Wave:
Why reading original source material is crucial to being truly informed


I’ve written before about how important it is to read original source material whenever possible. I know this is a lot to ask in our era of news overload, and yet – I came across a story recently that very clearly illustrates why we all must start doing this more often. It’s a piece I read on NBCnews.com last weekend, titled: Chicago business leaders say rising crime threatens city’s economic future.
At first glance, this seems like a well written story, full of several supporting quotes and interviews, and a “thesis,” or central topic, that’s clearly articulated in both the title (reference to “rising crime”) and the first line of the piece: “The rise in violent crime in Chicago has boiled over, drawing concern from business leaders and leading to political infighting among those charged with keeping the city safe.” It also has a nice direct quote in the second paragraph from a city politician, describing why rising crime is a concern.
BUT … there’s a major problem with this story that happens right away, in the third paragraph, with this statement:
Though overall crime is down so far this year compared with the same time a year ago,there has been an increasein homicides, sexual assaults and theft, including of motor vehicles.
On its face, nothing appears to be wrong with that sentence; I think few people familiar with Chicago news would dispute any of it. And yet, the crucial problem here is that it’s not telling you the whole story. There are two key pieces of information being left out, one of which you would only know if you clicked the link embedded under the words “there has been an increase.”
That link takes you to the actual raw data this reporter used to write this story, which is this chart from the Chicago Police Department (*kudos to the writer for embedding this, as many journalists and/or news outlets today don’t take the time to make their raw data available). The chart shows all of the hard data on citywide crime for both the past week and in comparison to the same data from years’ past. Here are screenshots of both:
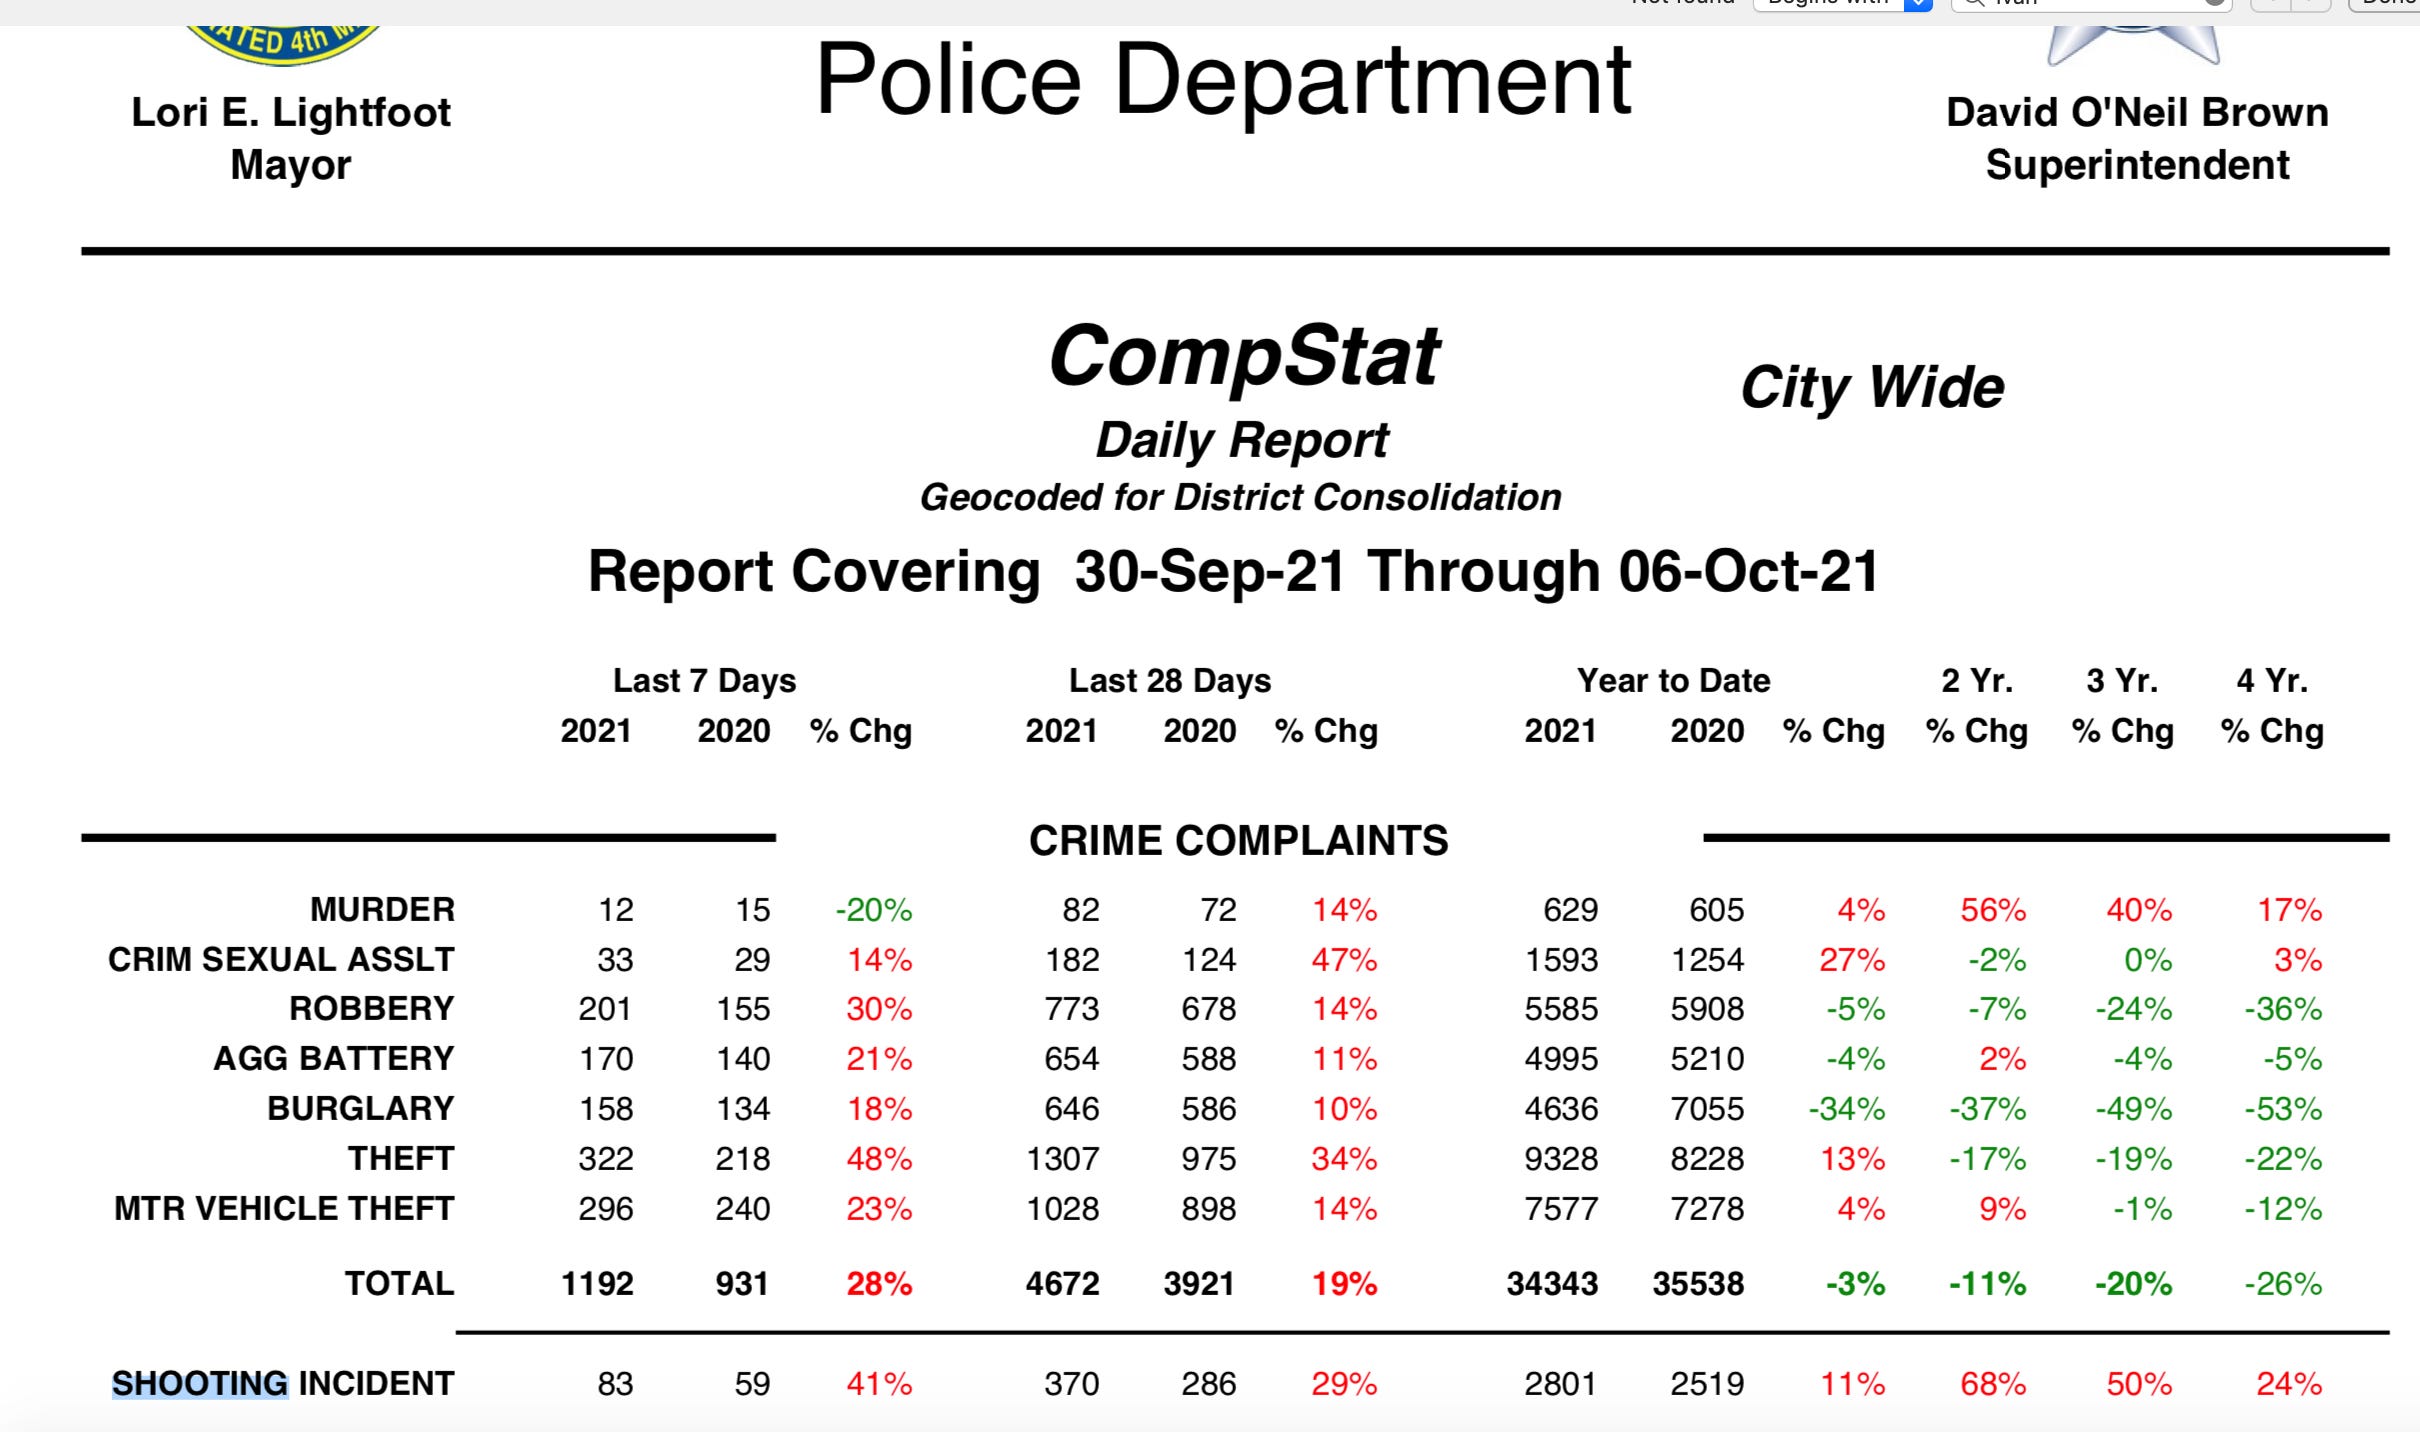

After looking over the chart we see that everything the writer mentioned in that sentence is indeed true – there has been “an increase in homicides, sexual assaults and theft, including of motor vehicles” in Chicago. BUT … look back once again at the last line in the first screenshot – the one labeled “shooting incident.”
Behind “criminal sexual assault” and “theft,” “shooting incidents” seem to be the third most common crime happening in Chicago right now – up 29% since last week and 11% since last year. Even more interesting are the “shooting incident” percentage increases from two, three and four years ago, which are 68%, 50% and 24%, respectively. When you compare all of those numbers to the numbers of murders in the same timeframes (56%, 40% and 17%, respectively), you see that, cumulatively, shootings have increased more steeply than any other reported violent crimes in the entire city of Chicago since 2017. And yet, there is no mention at all of shooting incidents on that sentence.
To be fair, this information does *sort of* eventually appear in this story, three quarters of the way through - a classic case of a buried lede if ever there was one (read about what buried ledes are in this blog post from August 2020):
Chicago has contended with about 2,600 shootings this year, up 10 percent from the same time last year, according todata from the Chicago Police Department, NBC News reported.
As of Friday, there have been 1,293 carjackings this year as compared to 939 this time last year.
But there’s some funny stuff going on with even THIS data, too. For some reason, the writer pulled a bait-and-switch, and linked in THIS section to a different chart, from earlier in September, which shows a 10% rise in shootings year-over-year, versus the 11% we saw in the more recent chart. Here’s a screenshot of the bulk of the chart so you can see the different dates and information for yourself:
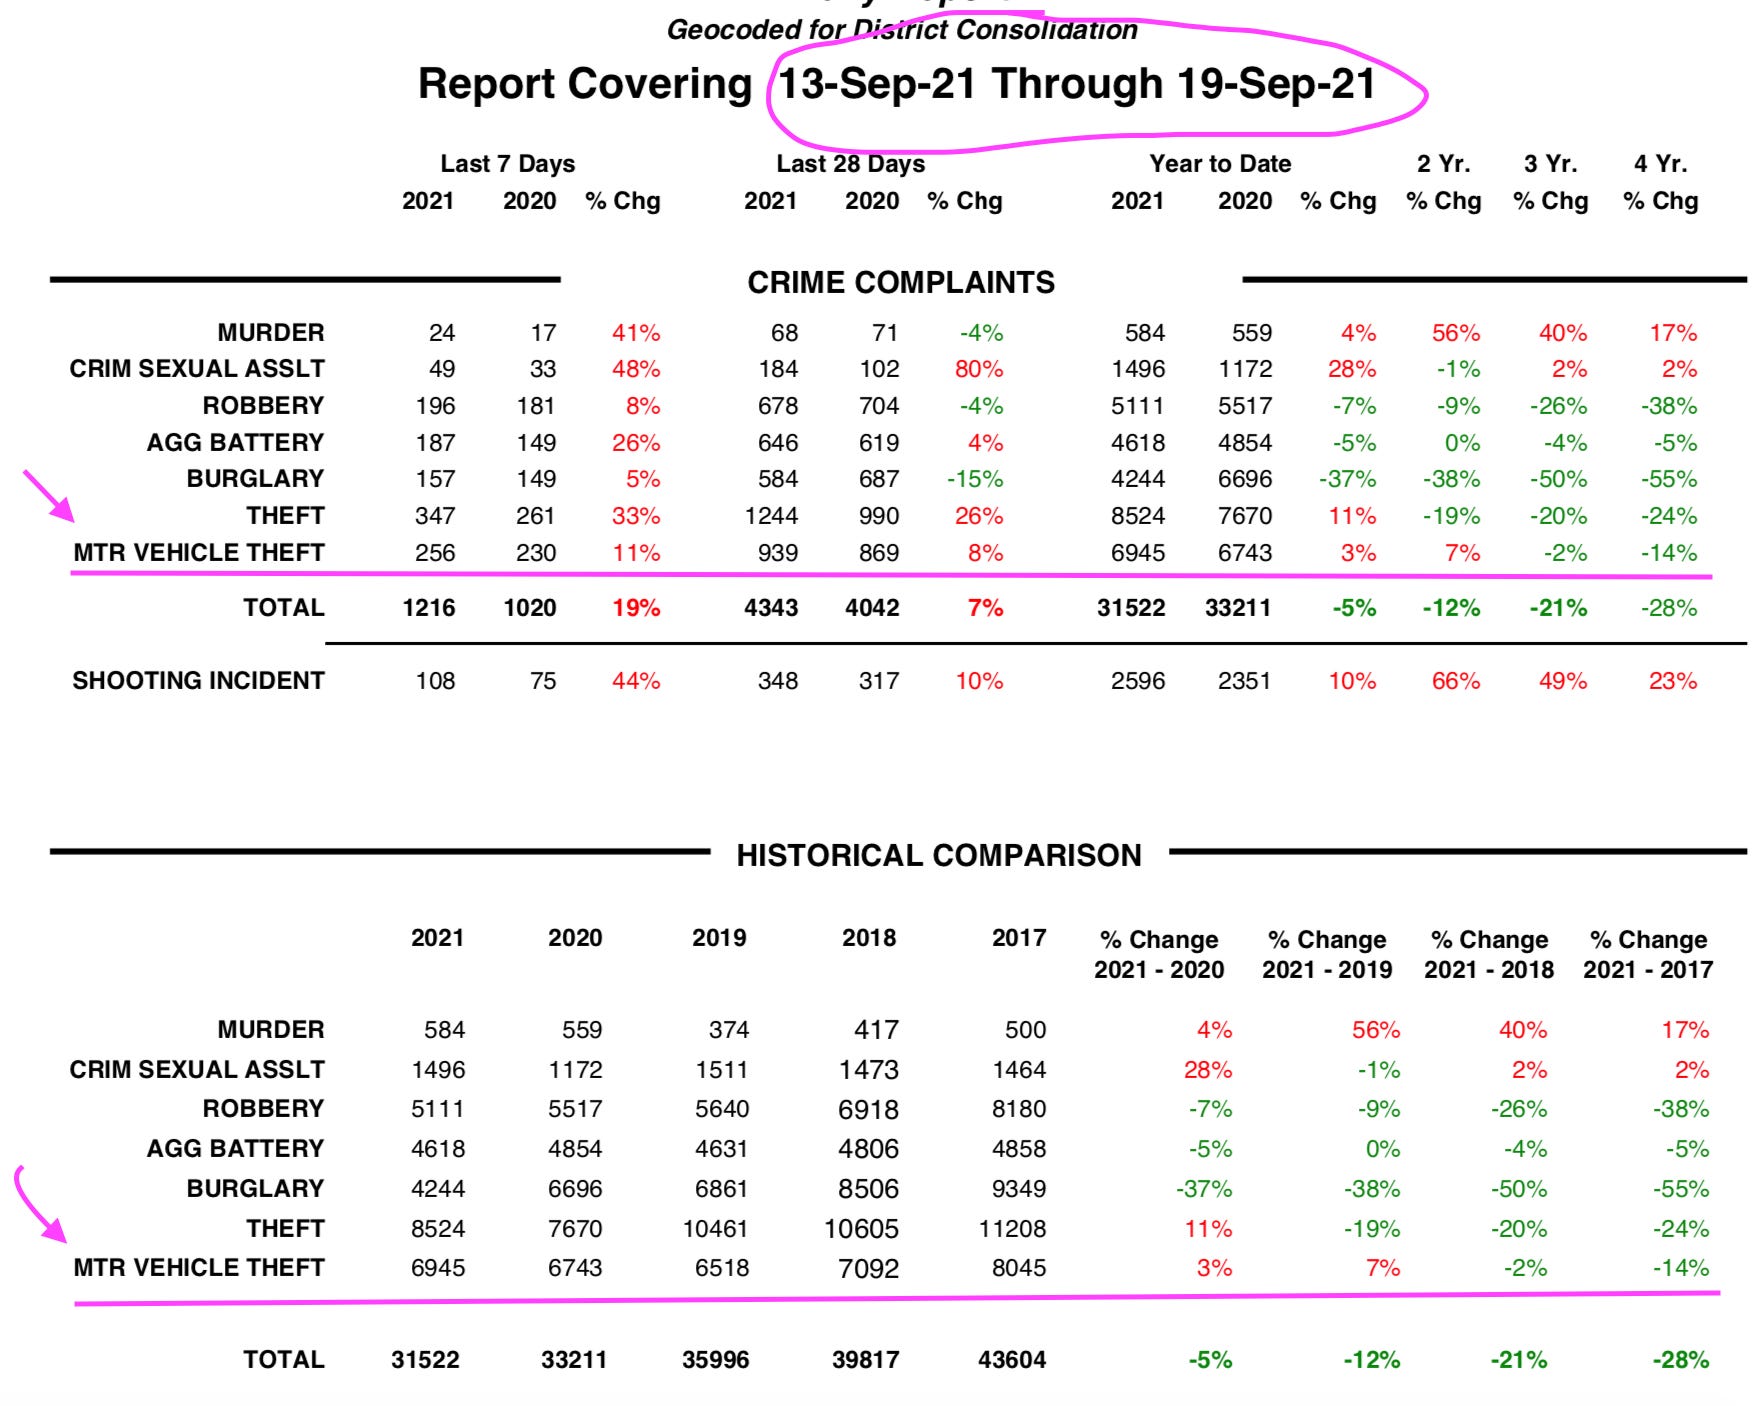
Remember how I said there were two key pieces of information being left out of that summary sentence at the top of the story? The second one, apparently, relates to car jackings. The first time I read those words – “car jackings” – I did a double take, as that was the first (and only) time anywhere in this whole story car jackings were ever mentioned. I also found it odd that nowhere in either of the official Chicago PD charts the article links to are there any references to car jackings. Only by looking at the numbers did I finally realize that the Chicago police department seems to be lumping “car jackings” in with general “motor vehicle theft” crimes (see pink arrows, above; also - maybe this explains why the Chicago PD distinguishes between just plain “theft” and “motor vehicle theft?”).
If you look at the numbers of “motor vehicle thefts” in the older chart, from mid-September, you notice that those incidents, which apparently include car jackings, had increased 11% from mid-September 2020 to mid-September 2021. But look back again at the first (and more recent) chart, and you will see that car theft - again, apparently including car jackings - has now suddenly increased 23% from the first week in October 2020 to the first week in October 2021 (!). This is a pretty scary statistic for anyone considering parking or driving anywhere near the city…
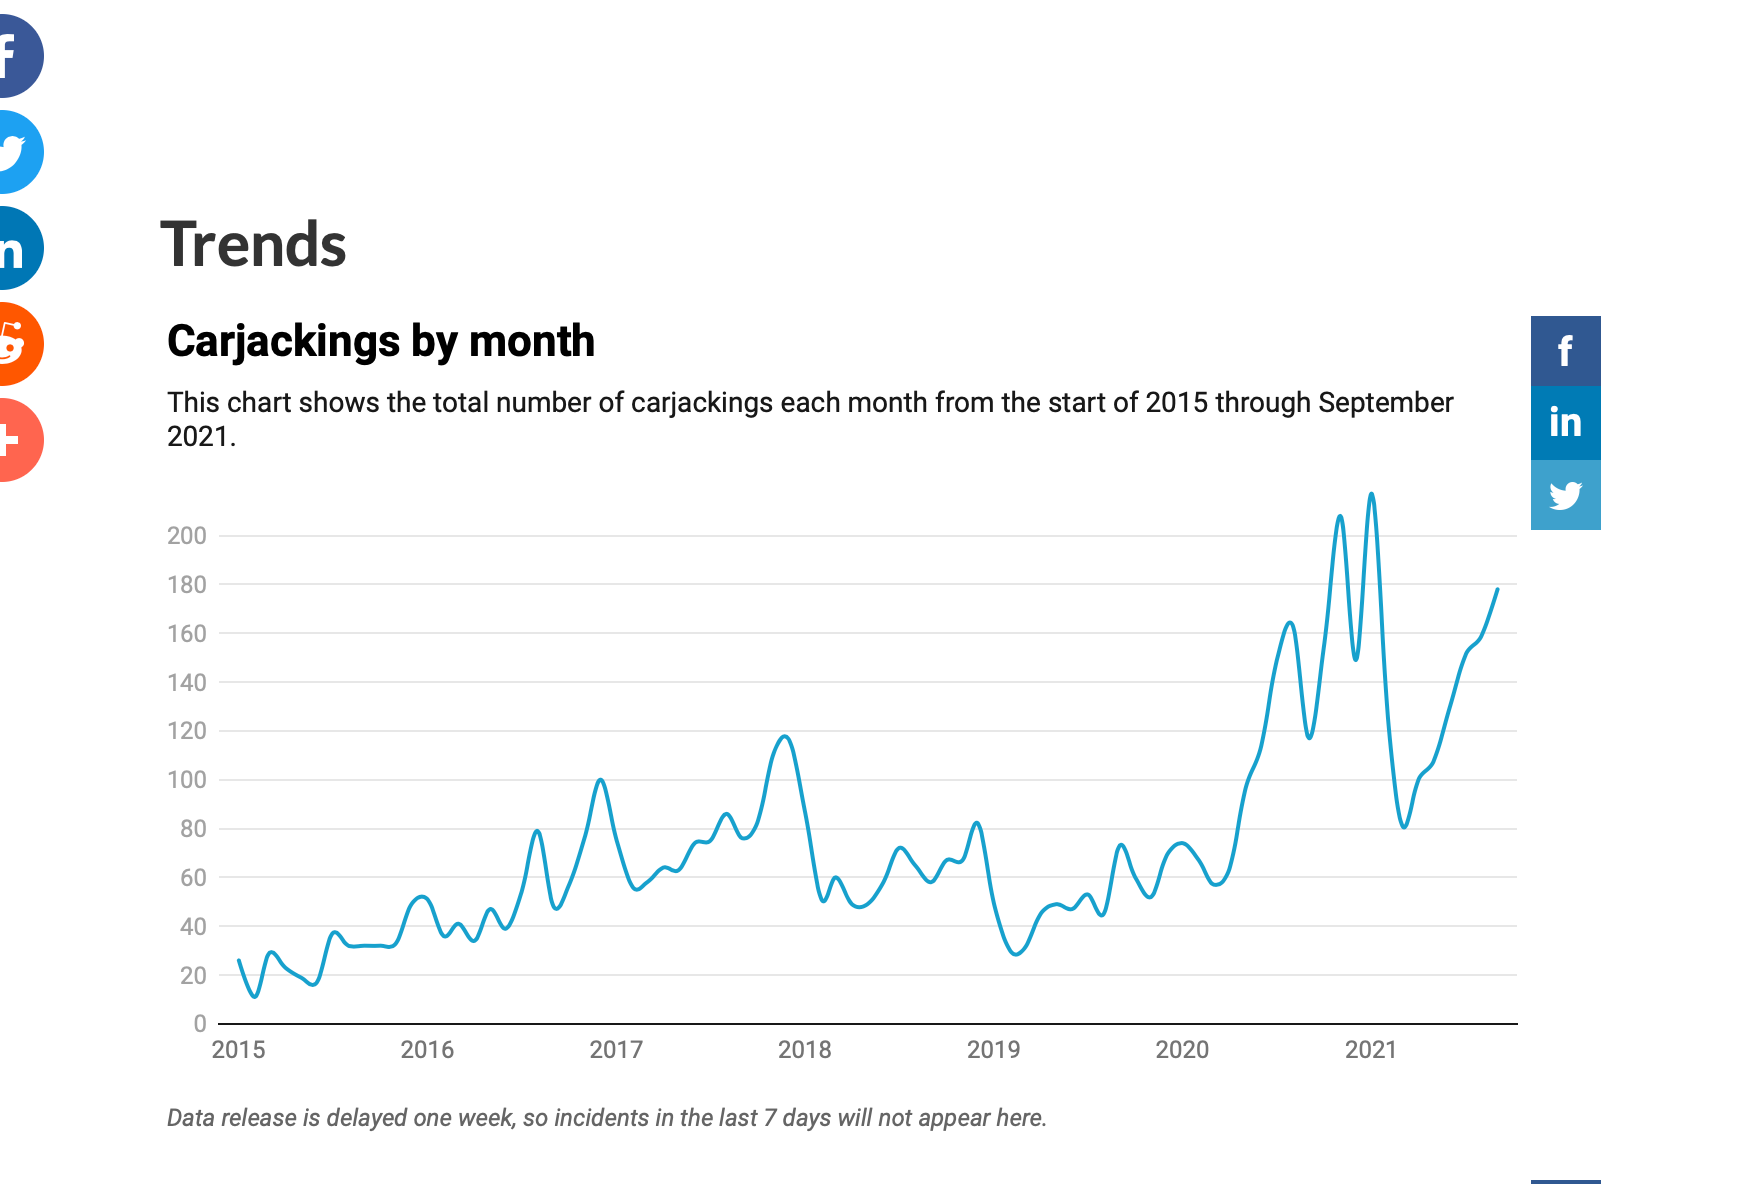
Just to be sure I wasn’t imagining things, I looked up information from local news sources on car jackings in Chicago. Apparently, this is such a rampant crime there that Chicago’s CBS affiliate maintains this website with the cumulative tally of car jackings by month and year. When you look at the “Carjackings by month” chart in particular, you get a sense for just how big of a problem this is so far in 2021:
It’s weird enough that the Chicago police department is lumping regular car thefts in with car jackings, but – as I set out to show you in this particular blog post – what’s even weirder is that the writer of this piece is going so far out of his way to hide and/or exclude some pretty crucial information about some of the most prevalent crimes in the city.
Right about now is where I find myself asking some pretty important questions:
What kind of “journalist” looks at these charts and decides that the increases in both shootings and car jackings are not relevant compared to all of the other increases that were mentioned at the very top of the story?
Does anyone believe that shootings and car jackings are irrelevant compared to those other crimes?
Do the victims of those crimes feel they are irrelevant?
As usual, I also find myself asking the biggest question of all: Why on earth is this writer working so hard to hide these two specific statistics from readers? I’d like to say it was an accident or an honest mistake, and yet – anyone with eyes who reads the hard data from the Chicago PD would have a hard time not seeing what I saw, at least in regards to shootings.
The fact that the writer slips up later on and indicates that car jackings are also a problem, plus the fact that he embeds an older chart later on in the piece which has more forgiving data, leaves no doubt in my mind that this reporter is intentionally hiding this information.
Why? I don’t live in Chicago so I’m not sure. But the real point of this post isn’t just about crime in Chicago. Stories like this one illustrate so clearly why we as news consumers can no longer rely on anyone to tell us the full story on any topic objectively. In 2021, news consumers must take the time to carefully look at original source material any chance they get and make decisions for themselves.